RealBloc
Interactive Maps for Every Neighborhood in America
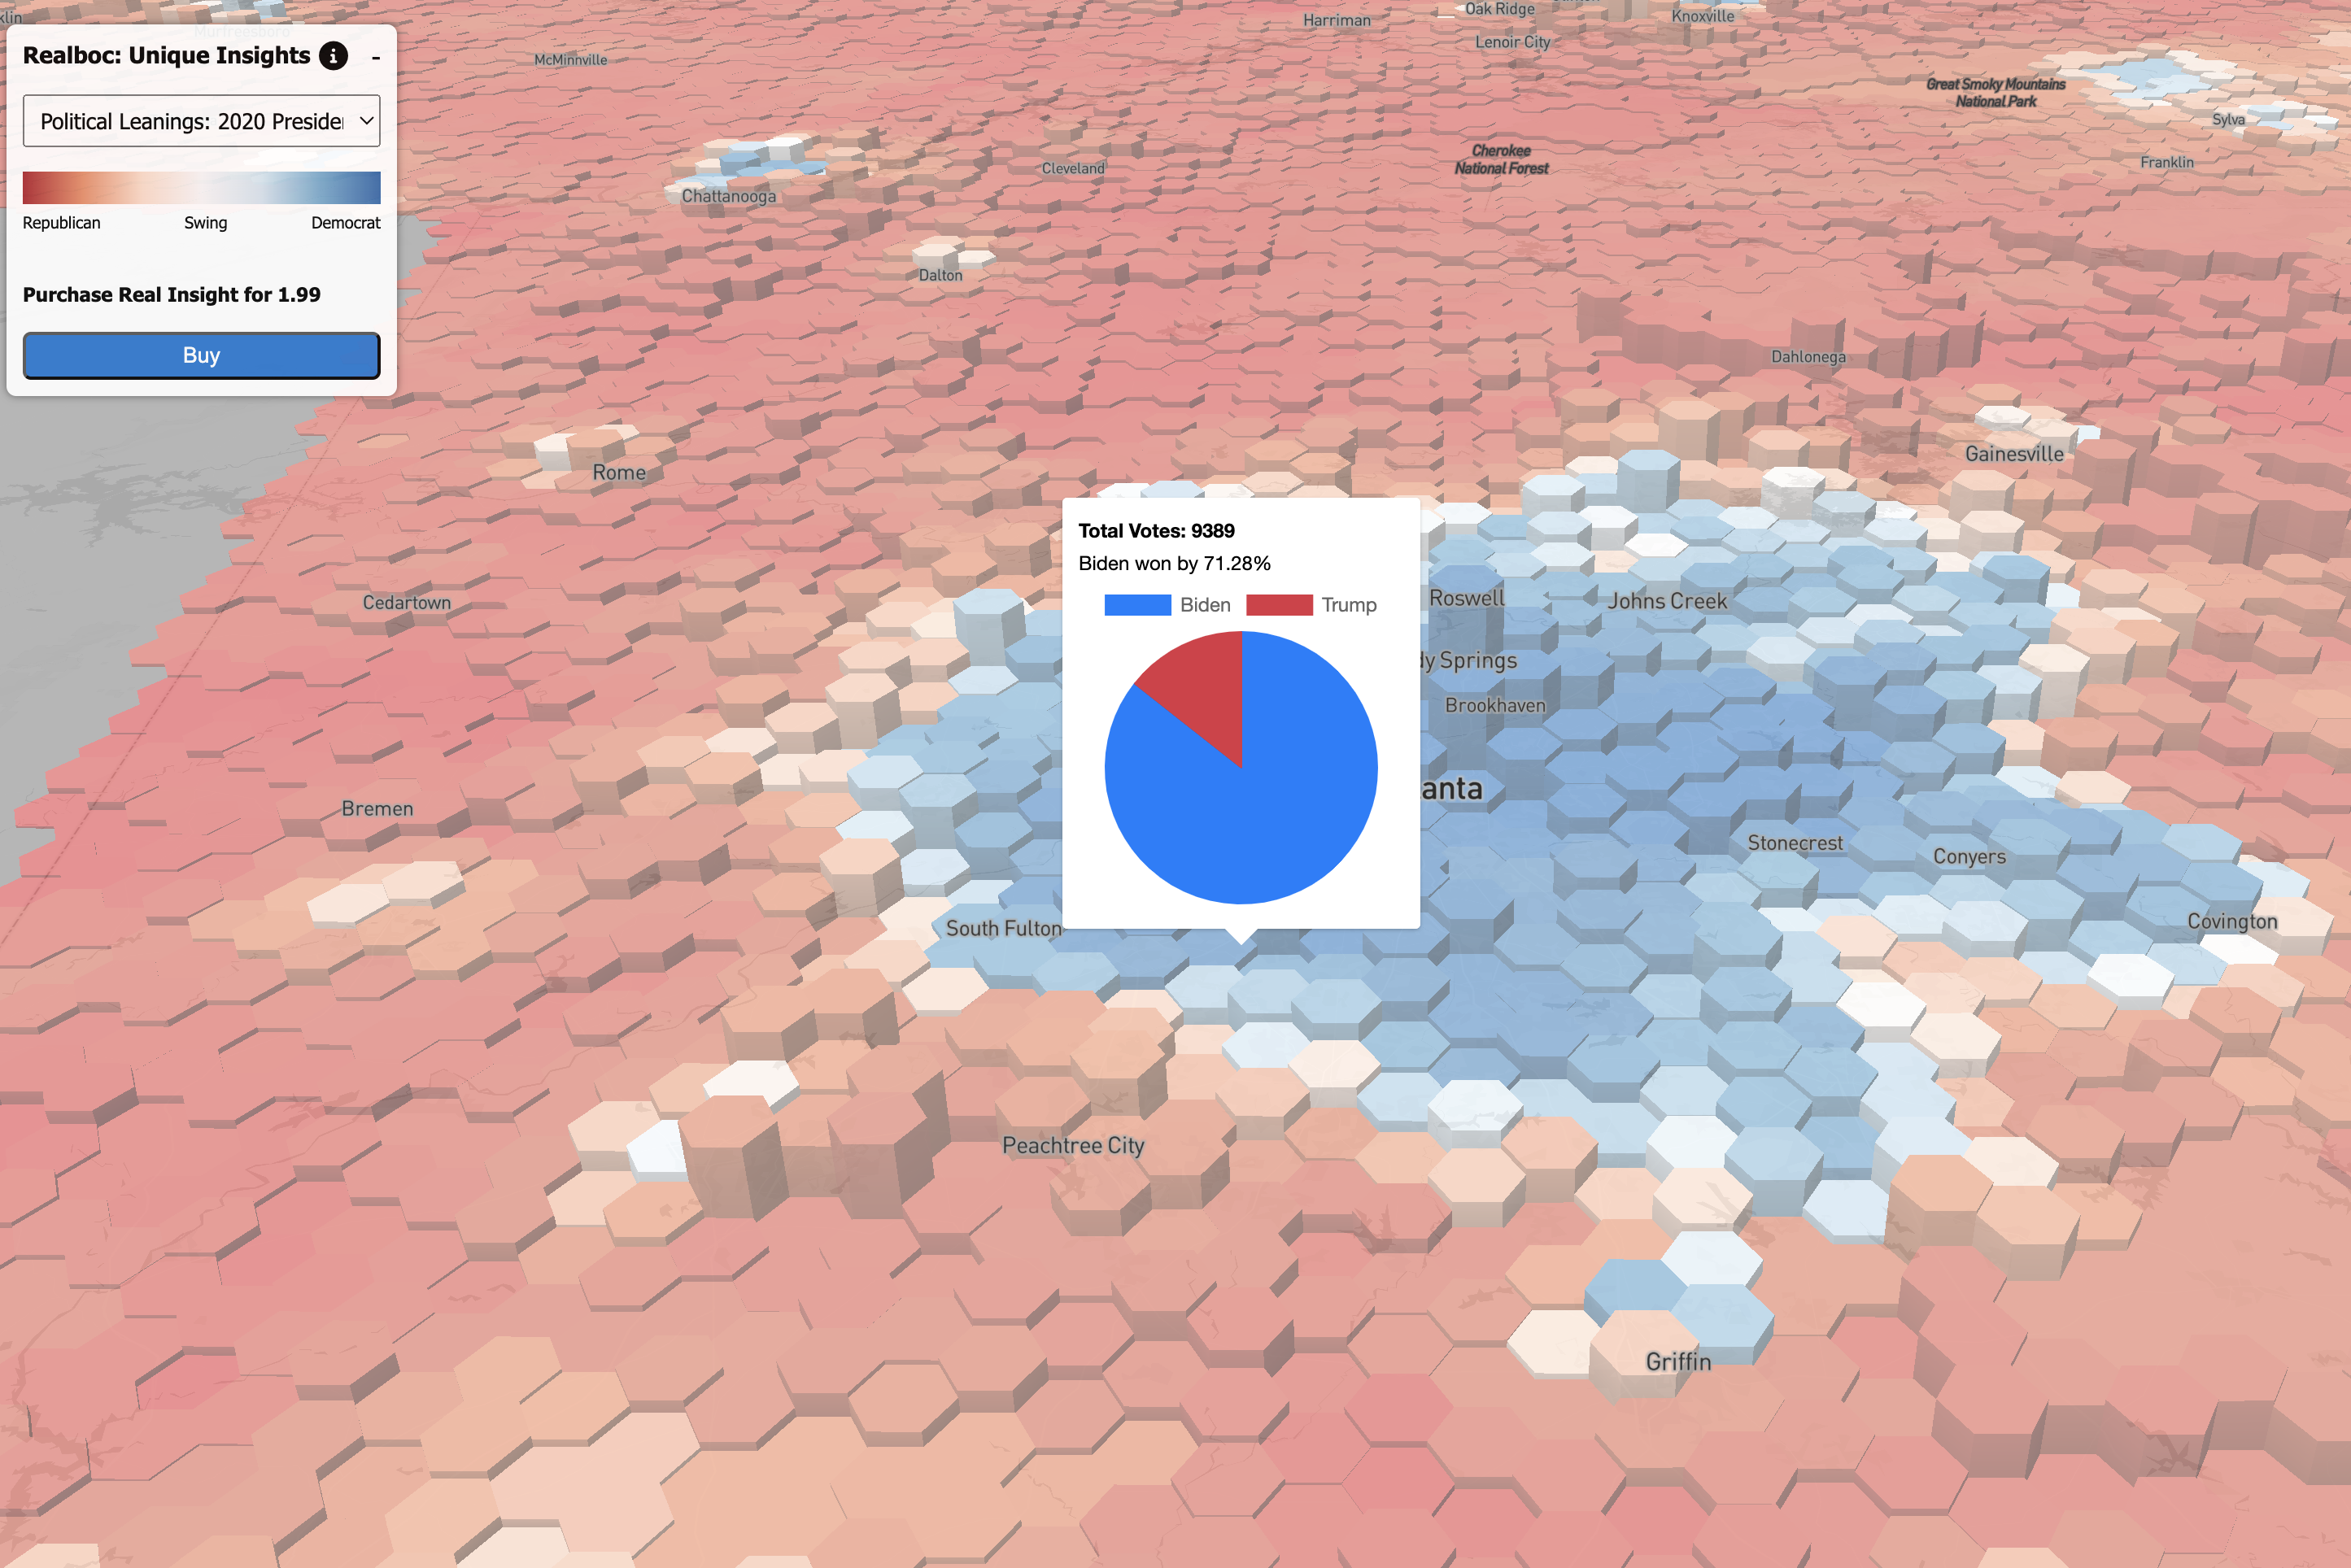
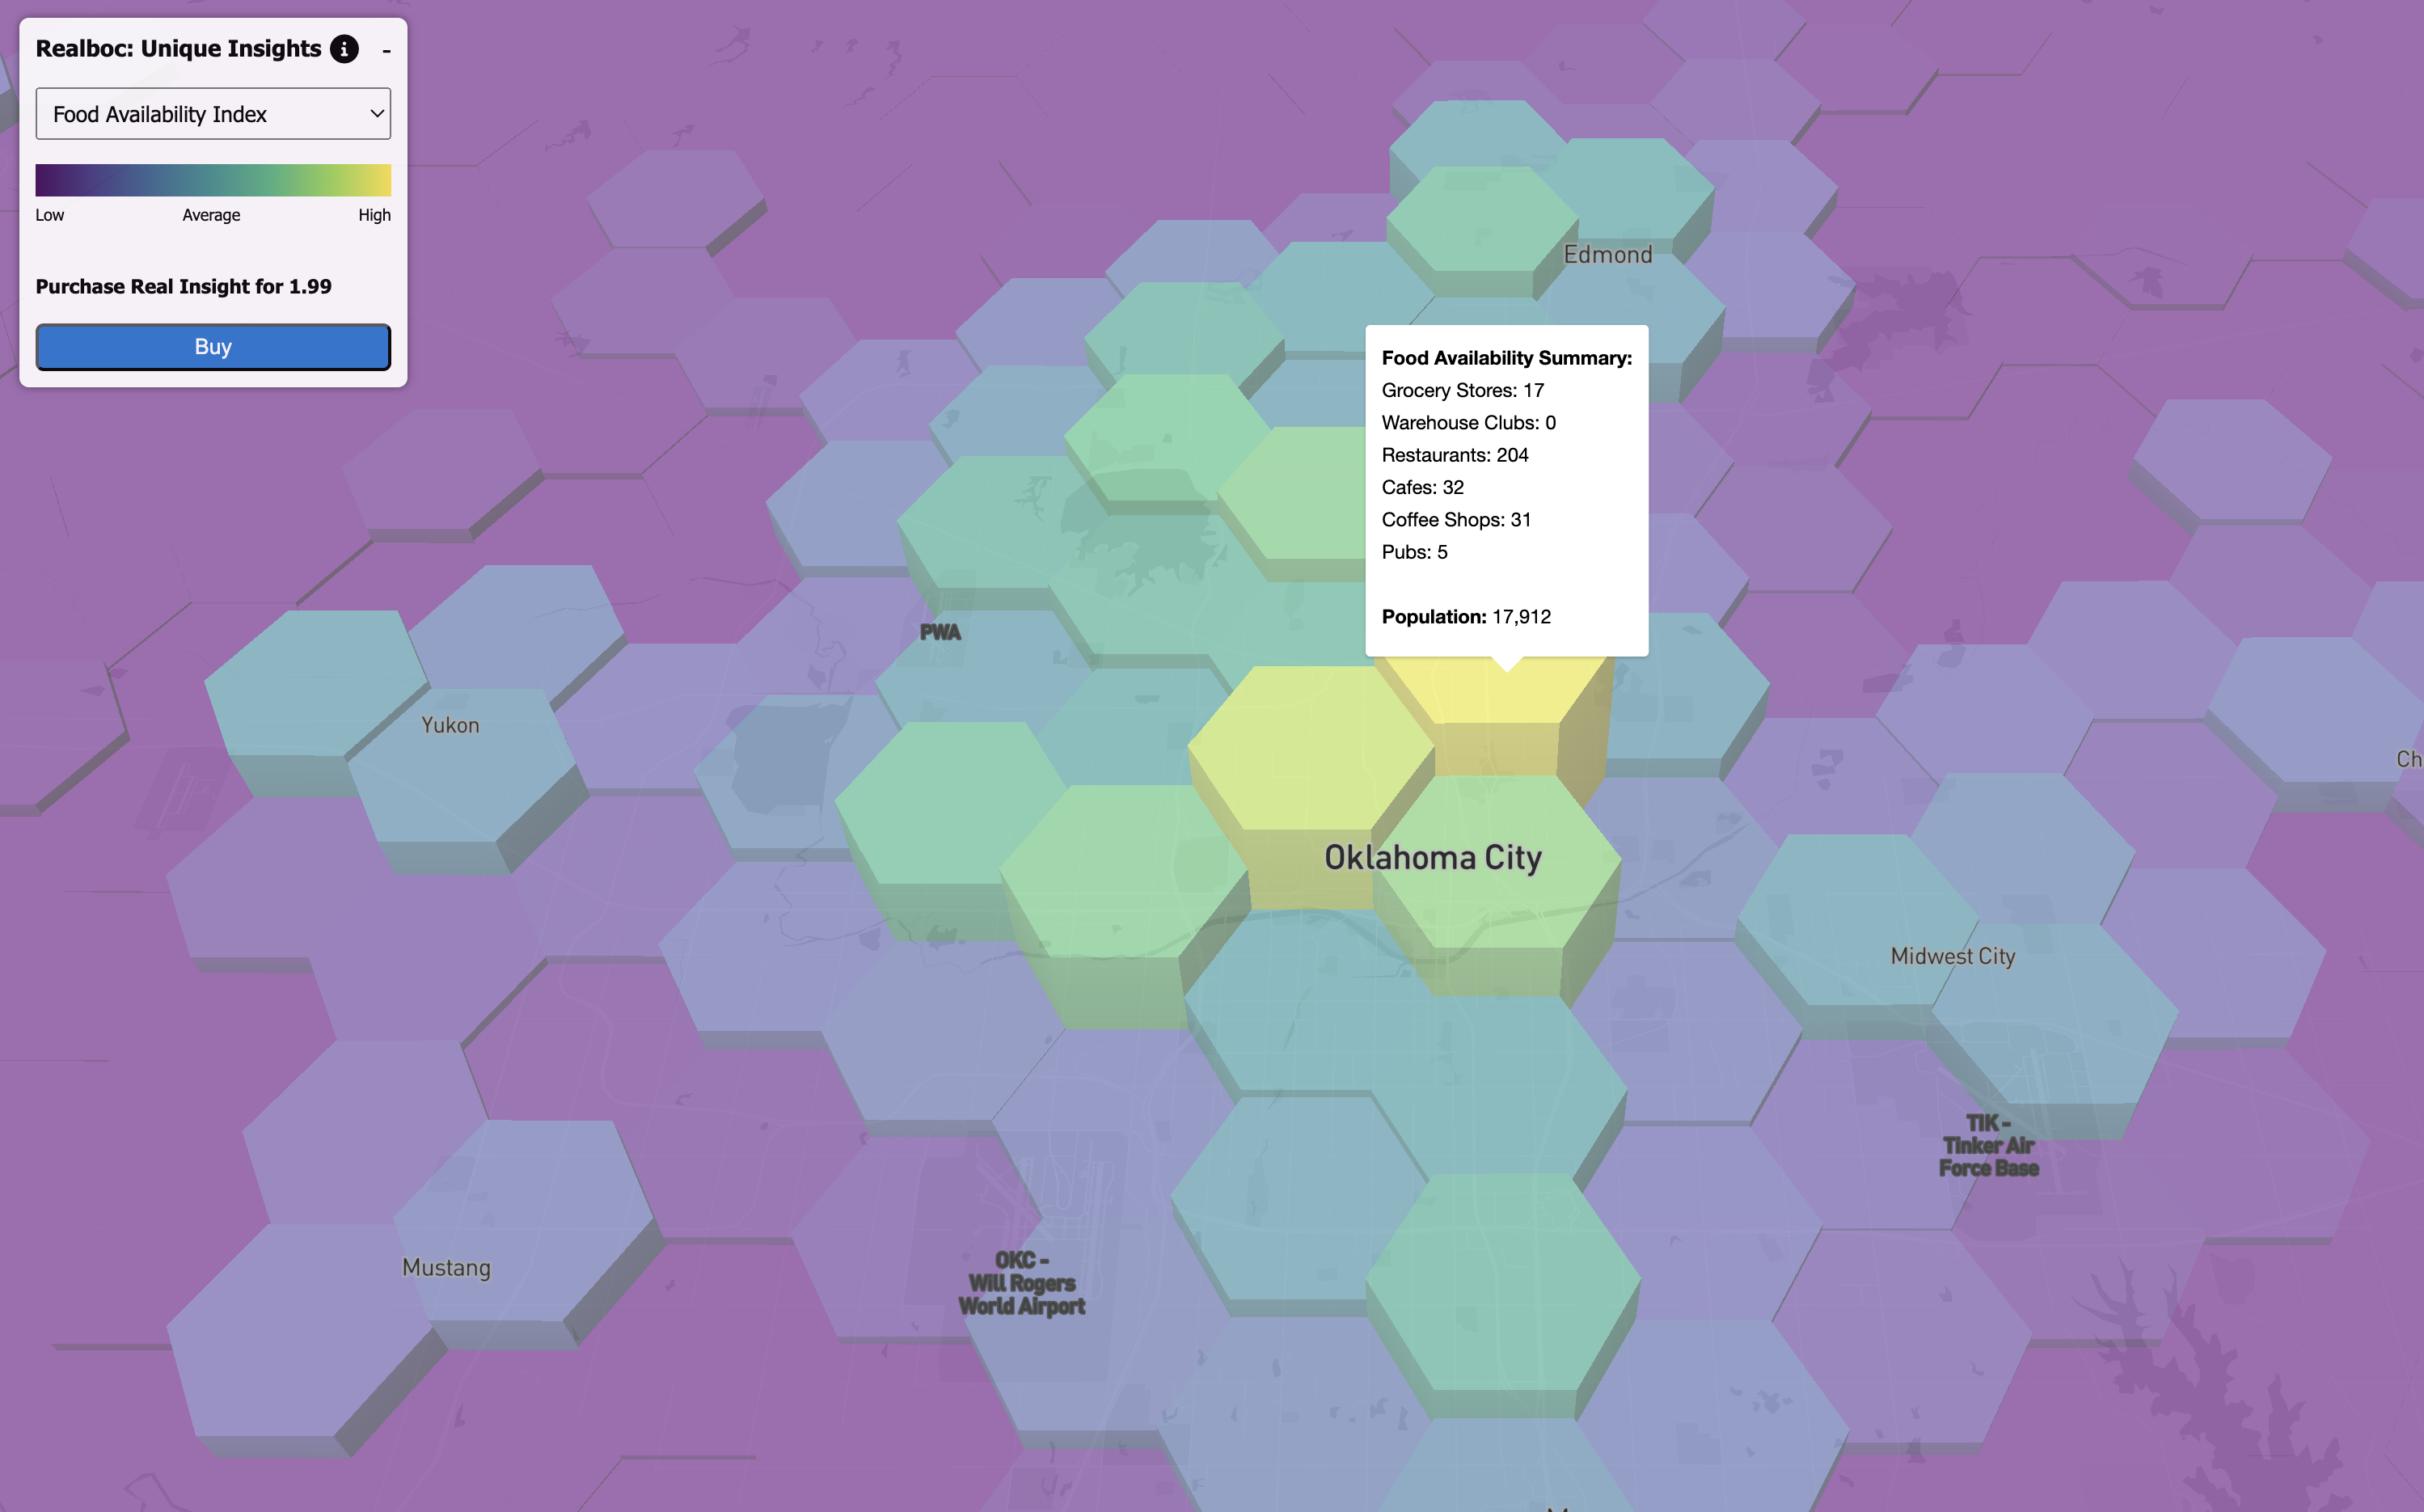
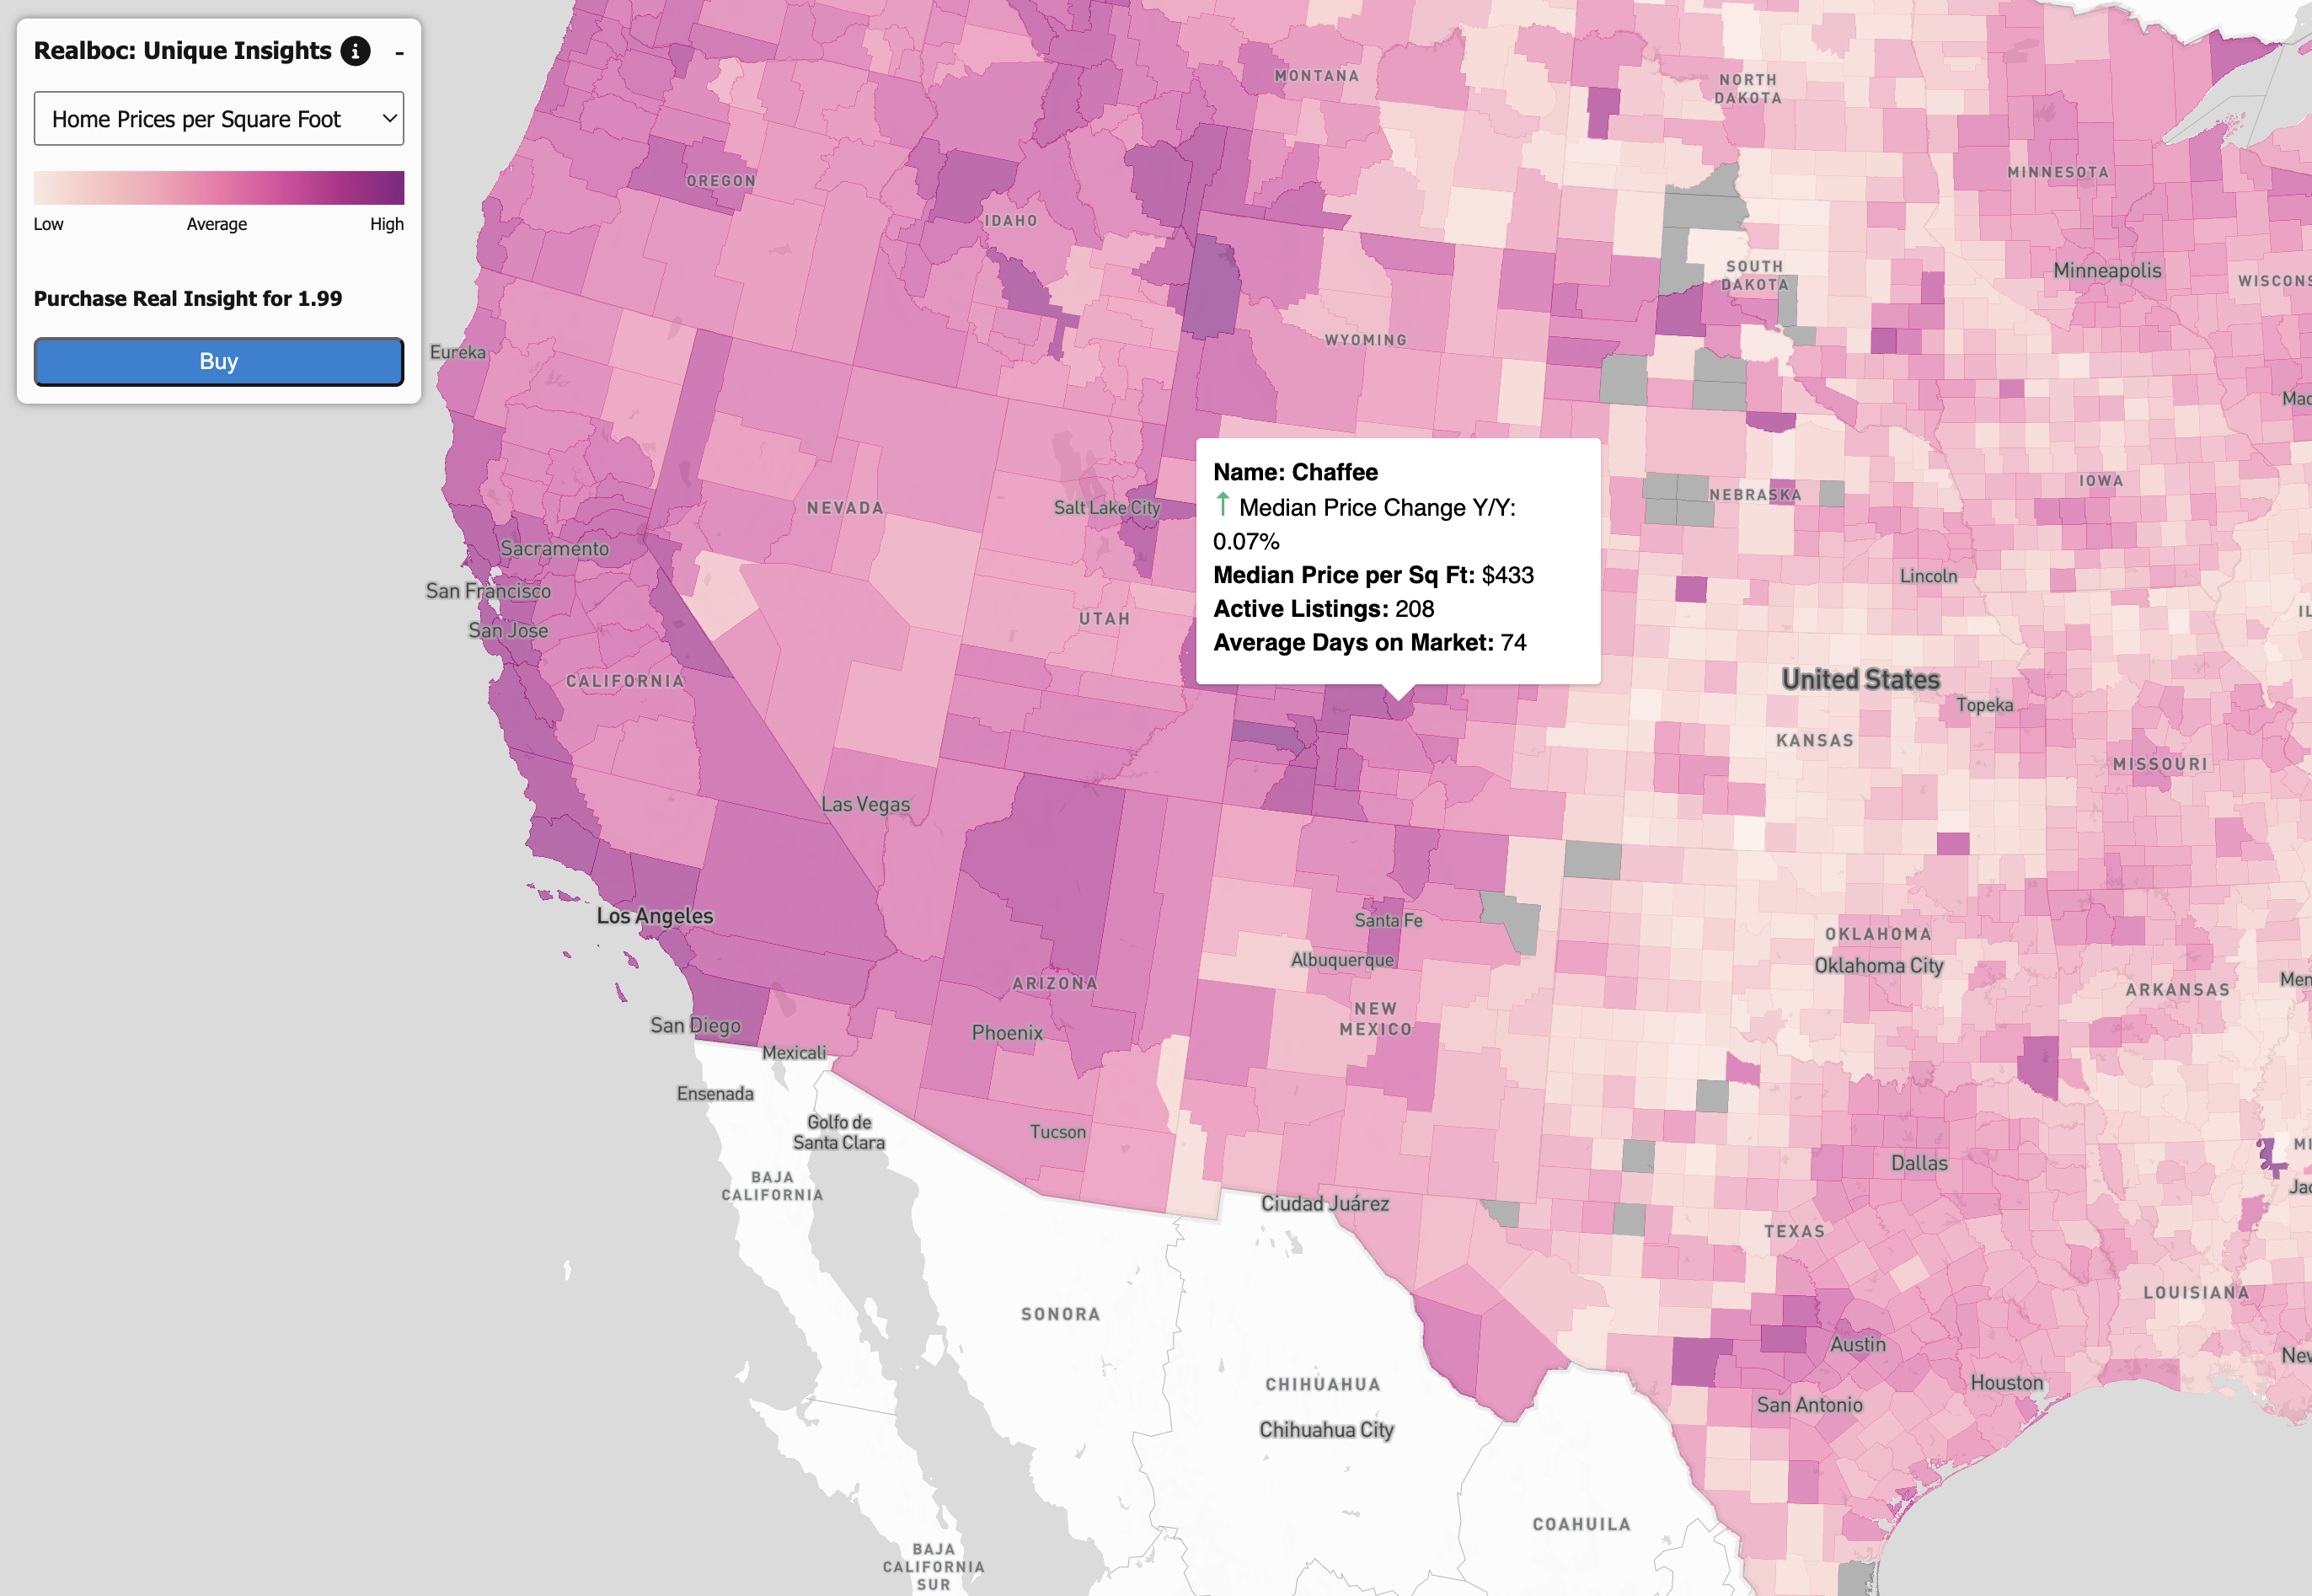
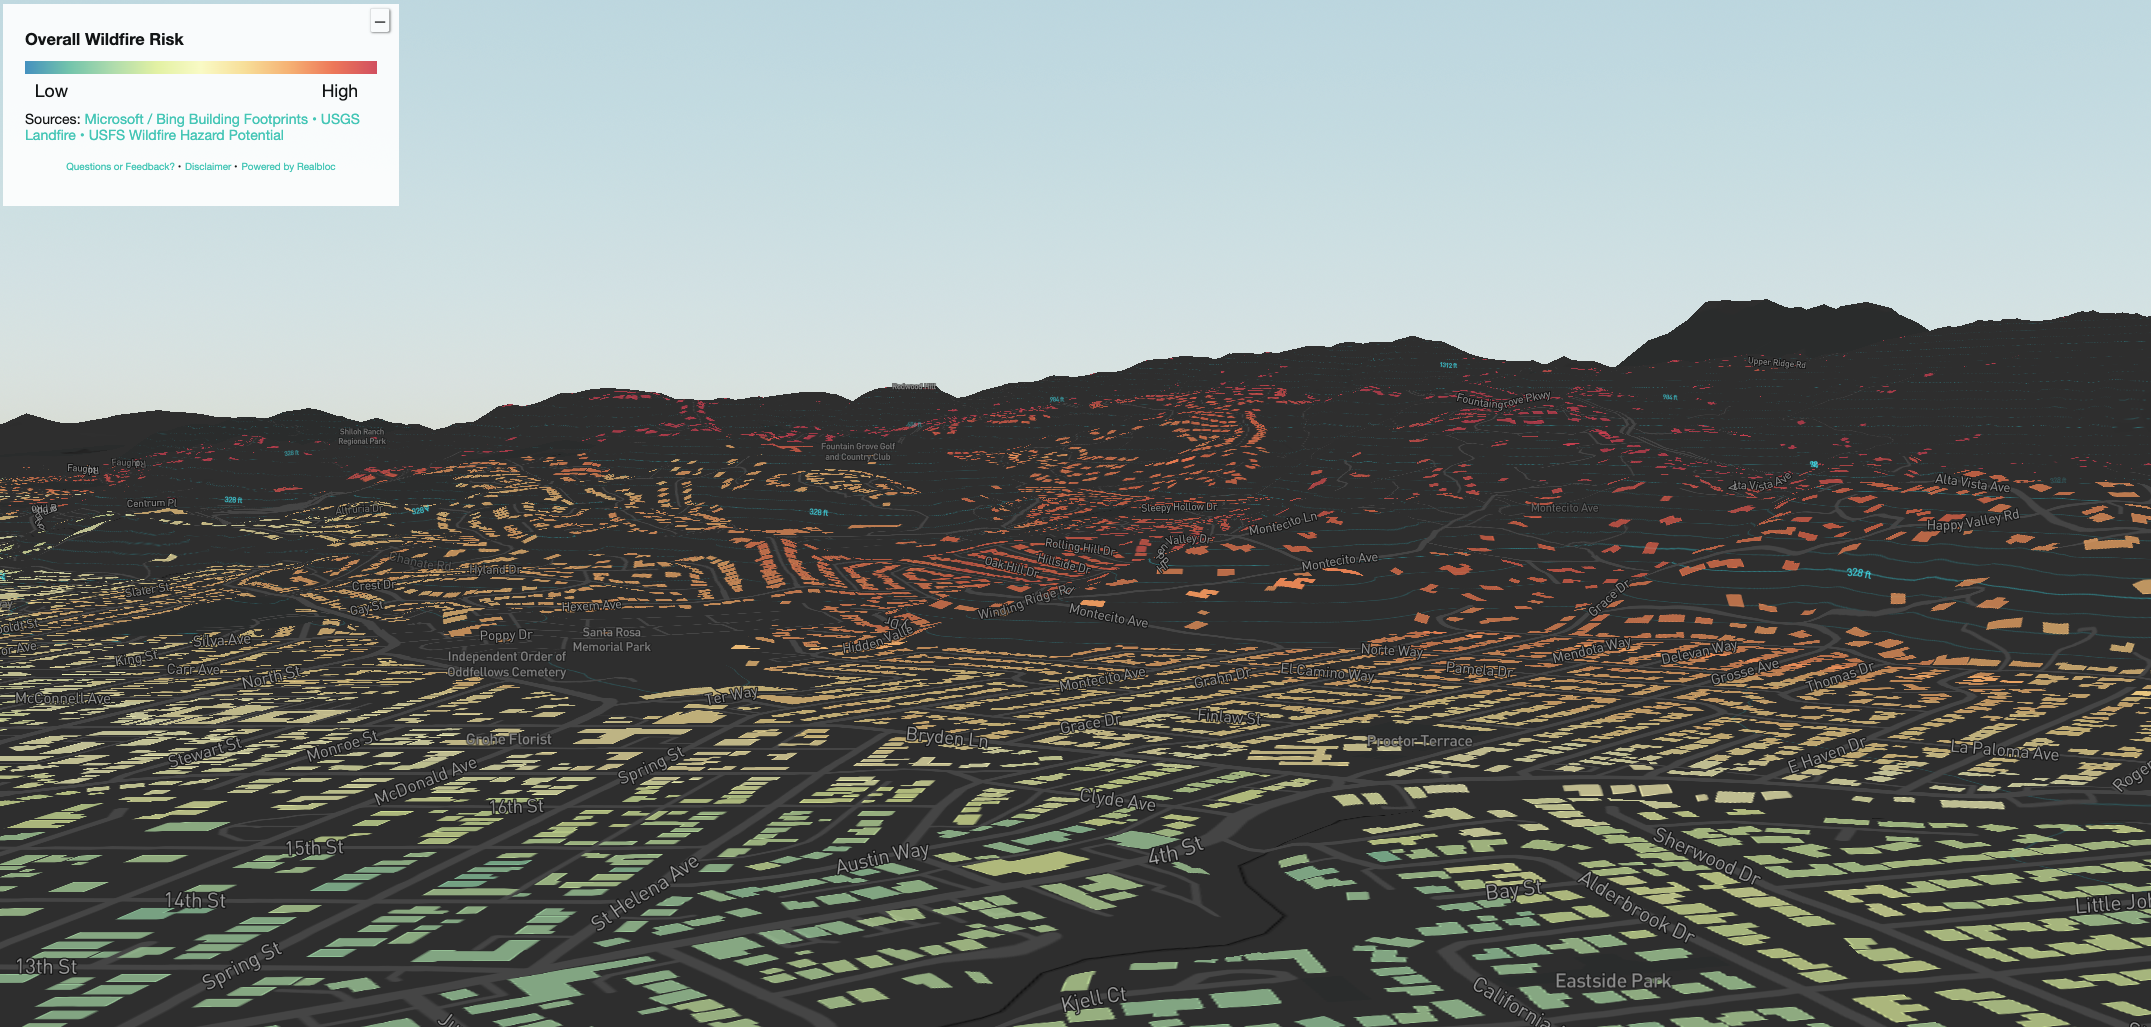
Explore gun violence risk, political leanings, food access, and home prices — block by block, across the entire US.
Explore gun violence risk, political leanings, food access, and home prices — block by block, across the entire US.
RealBloc is a free interactive map that lets you explore gun violence risk, political leanings, food access, and home prices across every neighborhood in the United States.
We use data from the Gun Violence Archive, Overture Maps Foundation, Kontur population estimates, the US Census, and Realtor.com. All sources are publicly available and updated regularly.
Yes, completely free — no account required.
Data is normalized by population so you see rates rather than raw counts — a city of 1 million and a town of 10,000 are fairly comparable. Shooting risk is shown at the H3 hex level (~174m resolution), giving block-level granularity across the entire country.
Each hex is scored by the weighted mix of food options within ~1km: grocery stores and markets score highest, sit-down restaurants next, then cafes and bars, and fast food lowest. High-population areas with no grocery access are flagged as likely food deserts.